Профилирование и оптимизация узких мест в Django
В предыдущей статье мы узнали, с чего начать оптимизацию производительности в django-приложении и выяснили, какие API следует оптимизировать в первую очередь. В этой статье мы узнаем, как оптимизировать выбранные API из приложения.
Профилирование API с django-silk
django-silk предоставляет функцию silk_profile, которую можно использовать для профилирования выбранного представления или фрагмента кода. Давайте возьмем медленный вид для профилирования и посмотрим на результаты.
from silk.profiling.profiler import silk_profile


@silk_profile()
def slow_api(request):
    time.sleep(2)
    return JsonResponse({'data': 'slow_response'})
Нам нужно добавить соответствующие параметры silk в настройки django, чтобы необходимые файлы данных профиля генерировались и хранились в указанных местах.
SILKY_PYTHON_PROFILER = True
SILKY_PYTHON_PROFILER_BINARY = True
SILKY_PYTHON_PROFILER_RESULT_PATH = '/tmp/'
После загрузки вышеуказанного представления мы можем увидеть информацию о профиле на странице профилирования шелка.
На странице профиля шелк показывает график профиля и выделяет путь, на который уходит больше времени.
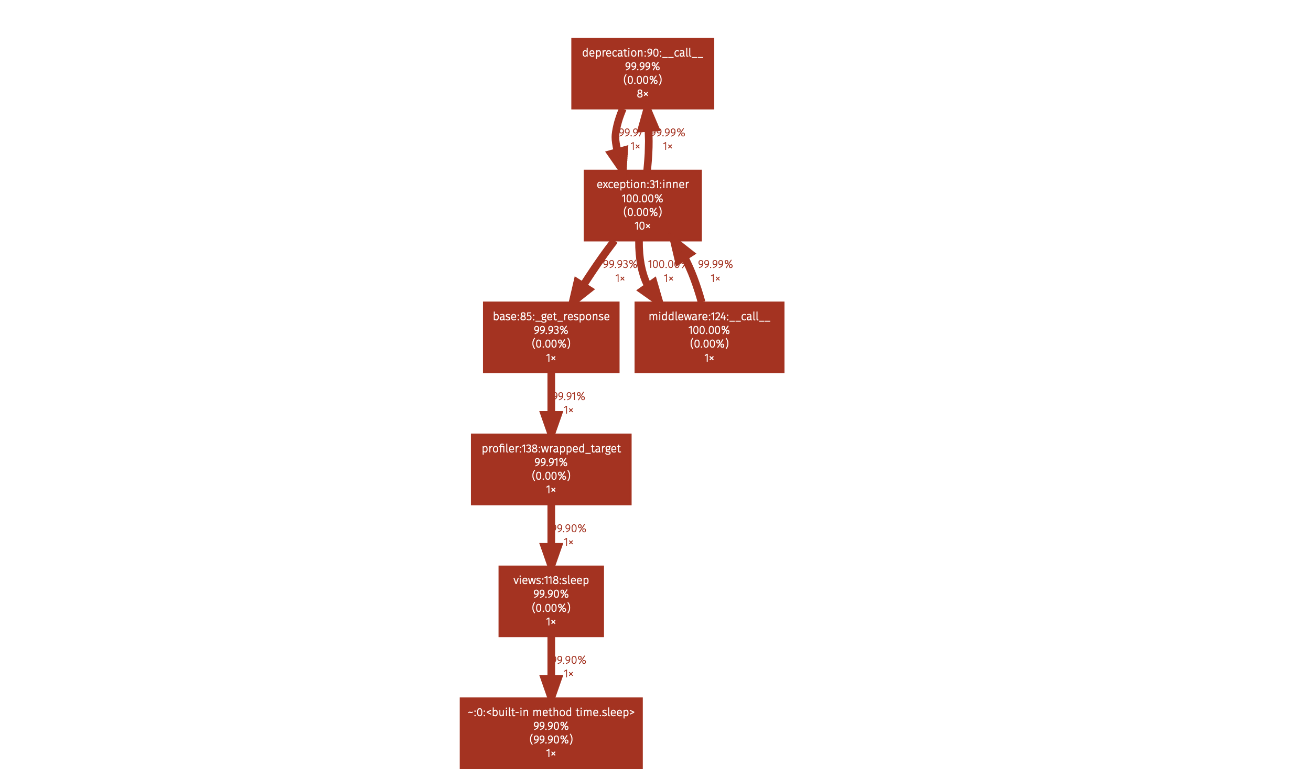
На этой же странице отображается статистика cprofile. Этот файл данных профиля можно загрузить и использовать с другими инструментами визуализации, такими как snakeviz.
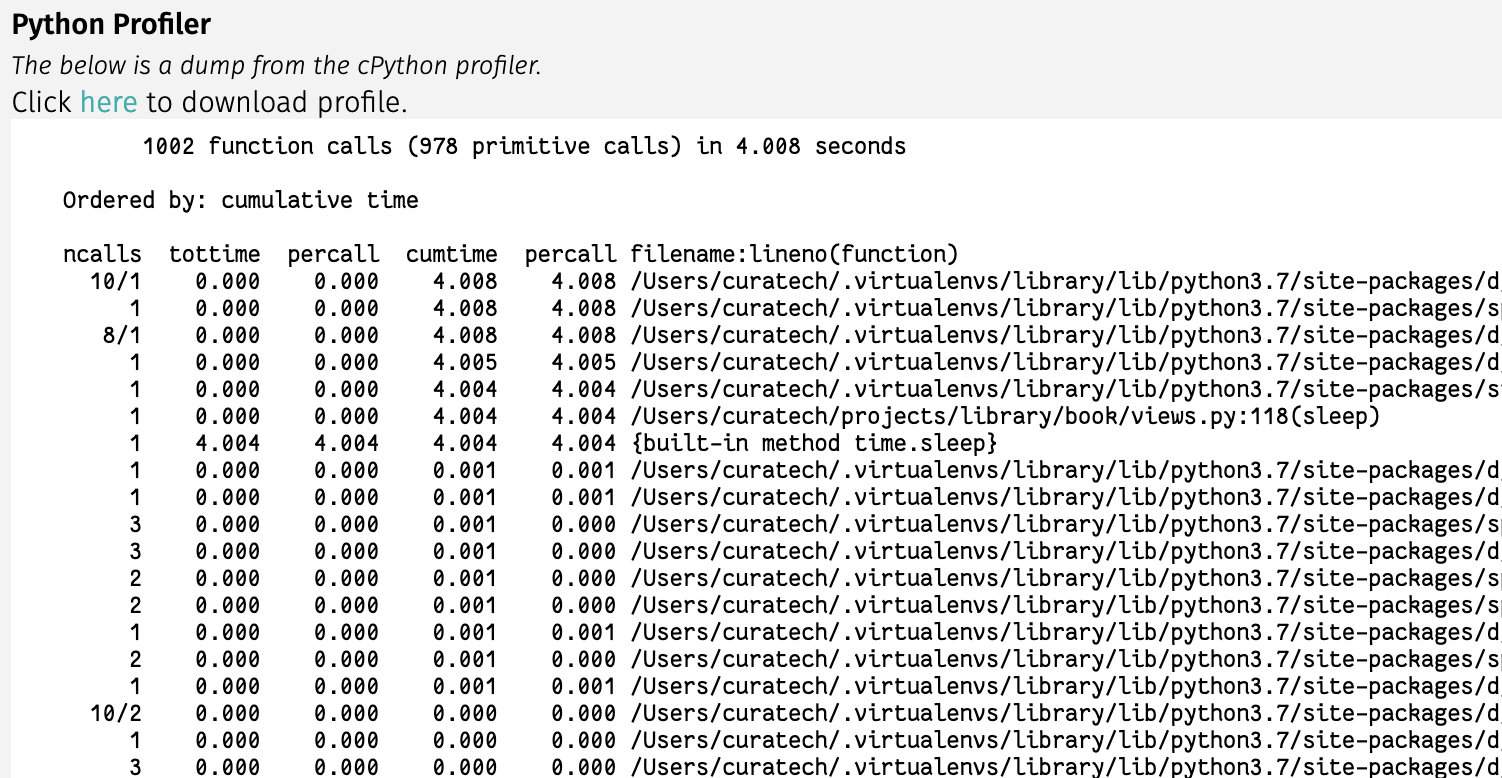
Посмотрев на приведенные выше данные, мы видим, что большая часть времени тратится time.sleep на просмотр.
Профилирование API с django-extensions
Если вы не хотите использовать silk, альтернативным способом профилирования представлений django является использование команды runprofileserver, предоставляемой пакетом django-extensions. Установите пакет django-extensions и затем запустите сервер следующей командой.
$ ./manage.py runprofileserver --use-cprofile --nostatic --prof-path /tmp/prof/
Эта команда запускает runserver с включенными инструментами профилирования. Для каждого запроса, сделанного к серверу, он будет сохранять соответствующий файл данных профиля .prof в папке /tmp/prof/.
После создания данных профиля, мы можем использовать инструменты просмотра данных профиля, такие как snakeviz, cprofilev для визуализации или просмотра данных профиля.
Установите snakeviz с помощью pip
$ pip install snakeviz
Откройте файл данных профиля с помощью snakeviz.
$ snakeviz /tmp/prof/api.book.list.4212ms.1566922008.prof
Показывает представление графика сосулек и представление таблицы данных профиля этого представления.
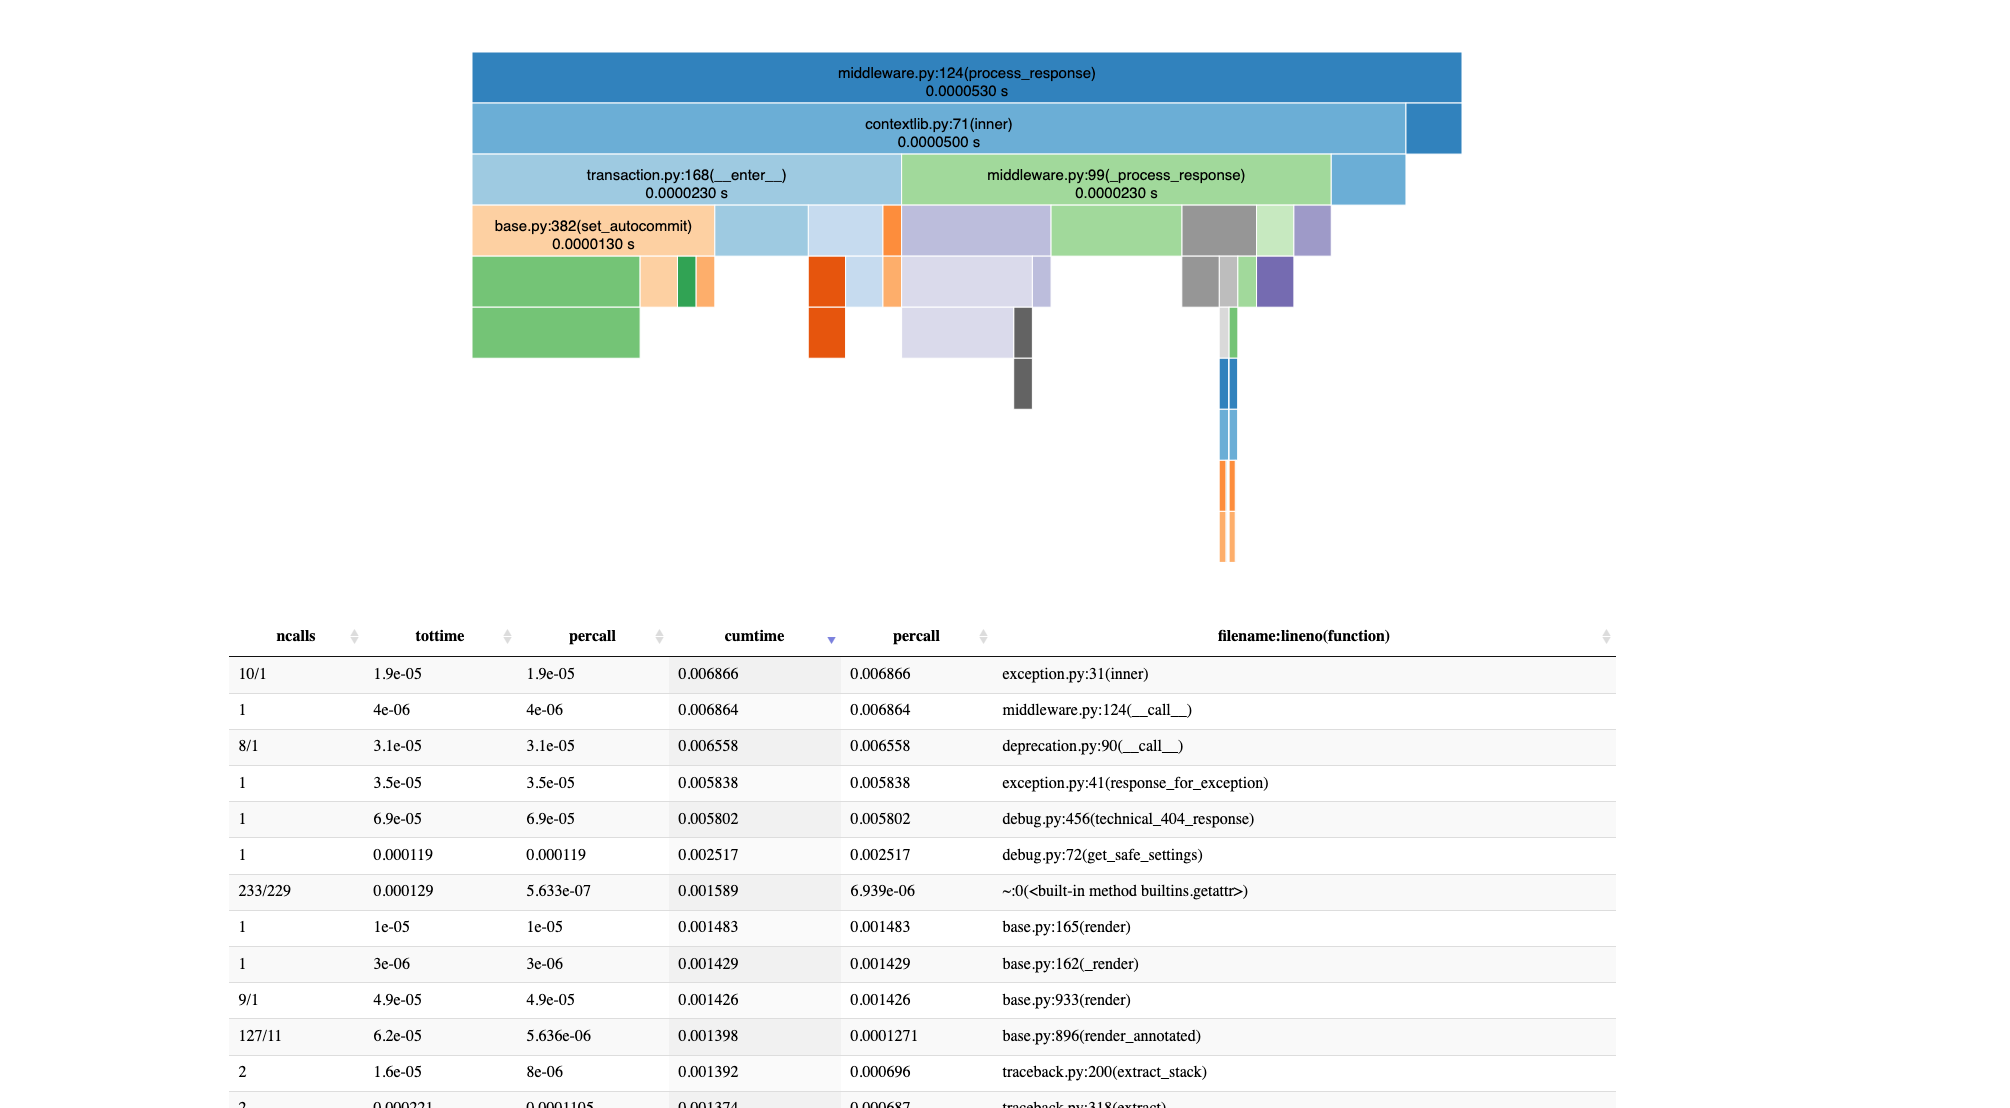
Это поможет точно определить, какая строка кода замедляет работу представления. Как только она будет определена, мы сможем предпринять соответствующие действия, например, оптимизировать этот код, установить кэш или переместить его в очередь задач, если он не должен выполняться в цикле запрос-ответ.
Вернуться на верх