Анализ временных рядов с помощью Pandas
Библиотека pandas в Python часто используется для импорта, управления и анализа наборов данных в различных форматах. В этой статье мы будем использовать ее для анализа цен на акции Amazon и выполнения некоторых базовых операций с временными рядами.
Оглавление:
- Вступление
- Данные временных рядов
- Импортирование биржевых данных и необходимых библиотек Python.
- Панды для анализа временных рядов
- Сдвиг времени
- Крутящиеся окна
- Заключение
Введение
Фондовые рынки играют важную роль в экономике страны. Правительства, частные компании и центральные банки внимательно следят за колебаниями на рынке, поскольку им есть что выиграть или потерять от этого. Из-за изменчивого характера фондового рынка анализ цен на акции является сложной задачей - именно здесь на помощь приходит Python. Благодаря встроенным инструментам и внешним библиотекам Python делает процесс анализа сложных данных фондового рынка простым и легким.
Пререквизиты
Мы будем анализировать биржевые данные с помощью Python 3, pandas и Matplotlib. Чтобы извлечь полную пользу из этой статьи, вы должны быть знакомы с основами pandas, а также с библиотекой для построения графиков Matplotlib.
Данные временного ряда
Данные временного ряда - это последовательность точек данных в хронологическом порядке, которая используется в бизнесе для анализа прошлых данных и составления прогнозов на будущее. Эти точки данных представляют собой набор наблюдений в определенное время и через равные промежутки времени, обычно с индексом времени и соответствующим значением. В нашей повседневной жизни распространенными примерами данных временных рядов являются:
- Измерение погодных температур
- Измерение количества поездок на такси в месяц
- Прогнозирование цен на акции компании на следующий день
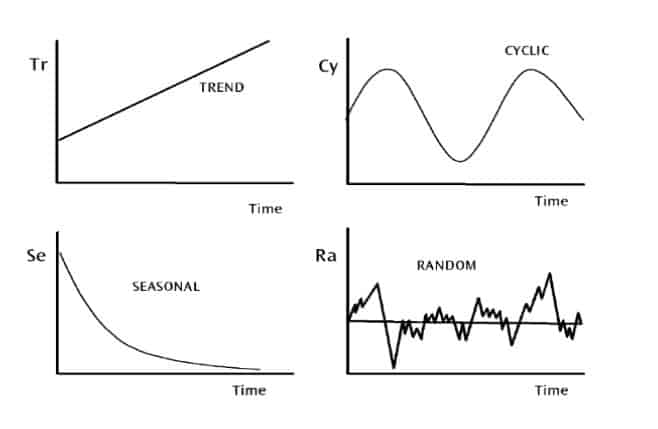
Вариации данных временного ряда
- Изменение тренда: движется вверх или вниз по достаточно предсказуемой схеме в течение длительного периода времени.
- Сезонная вариация: регулярная и периодическая; повторяется в течение определенного периода, такого как день, неделя, месяц, сезон и т.д.
- Циклическая вариация: соответствует деловым или экономическим циклам "бум-буст", или является циклической в какой-то другой форме
- Случайные колебания: неустойчивые или остаточные; не подпадают ни под одну из трех вышеперечисленных классификаций.
Вот четыре варианта визуализации данных временного ряда:
Импортирование биржевых данных и необходимых библиотек Python
Чтобы продемонстрировать использование pandas для анализа акций, мы будем использовать цены на акции Amazon с 2013 по 2018 год. Мы берем данные из Quandl, компании, предлагающей Python API для получения рыночных данных. CSV-файл данных, приведенных в этой статье, можно загрузить из репозитория статьи.
Откройте редактор по своему выбору и введите следующий код для импорта библиотек и данных, соответствующих этой статье.
Пример кода для этой статьи можно найти в репозитории на Github.
# Importing required modules
import pandas as pd
import numpy as np
import matplotlib.pyplot as plt

# Settings for pretty nice plots
plt.style.use('fivethirtyeight')
plt.show()

# Reading in the data
data = pd.read_csv('amazon_stock.csv')
Первый взгляд на цены акций Amazon
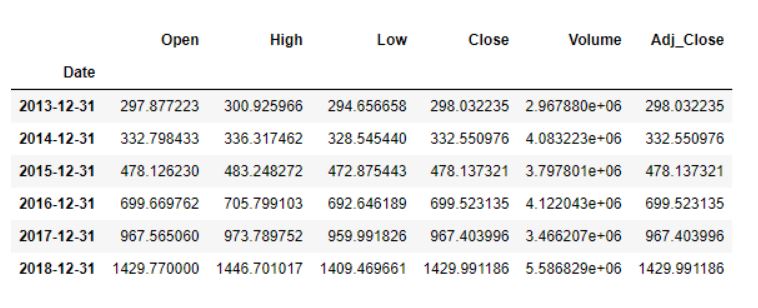
Рассмотрим первые несколько столбцов набора данных:
# Inspecting the data
data.head()
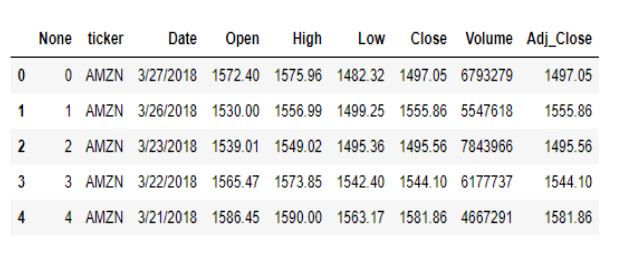
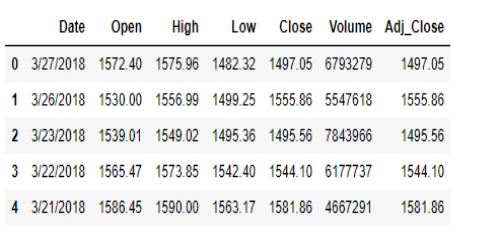
Давайте избавимся от первых двух столбцов, поскольку они не добавляют никакой ценности к набору данных.
data.drop(columns=['None', 'ticker'], inplace=True)
data.head()
Теперь давайте рассмотрим типы данных различных компонентов.
data.info()
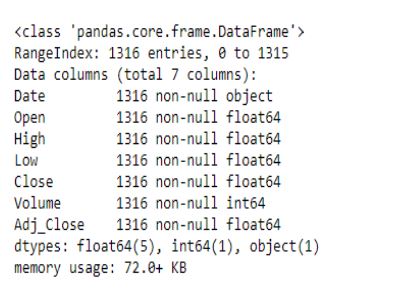
Похоже, что столбец Date обрабатывается как строка, а не как дата. Чтобы исправить это, мы воспользуемся функцией pandas to_datetime(), которая преобразует аргументы в даты.
# Convert string to datetime64
data['Date'] = data['Date'].apply(pd.to_datetime)
data.info()
В последнюю очередь мы хотим убедиться, что столбец Date является индексным столбцом.
data.set_index('Date', inplace=True)
data.head()

Теперь, когда наши данные преобразованы в нужный формат, давайте посмотрим на их столбцы для дальнейшего анализа.
- В колонках Open и Close указаны цена открытия и цена закрытия акций в определенный день.
- В колонках High и Low указаны соответственно самая высокая и самая низкая цена акции в конкретный день.
- Колонка Volume показывает общий объем акций, торгуемых в определенный день.
В колонке Adj_Close представлена скорректированная цена закрытия, или цена закрытия акции в любой день торгов, скорректированная с учетом любых распределений и/или корпоративных действий, происходящих в любое время до открытия следующего дня. Скорректированная цена закрытия часто используется при изучении или детальном анализе исторической доходности.
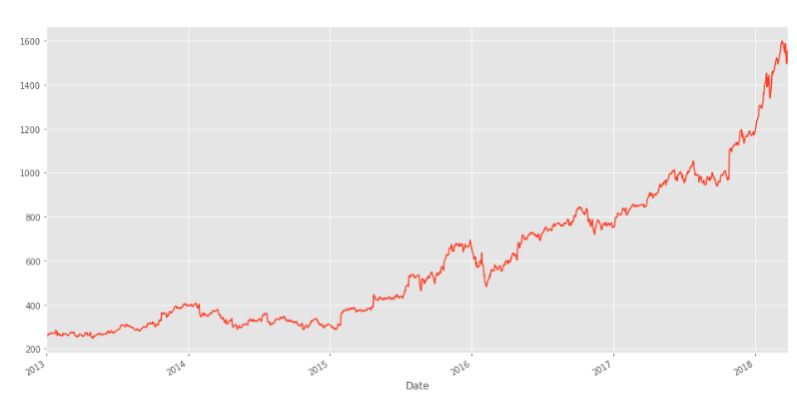
data['Adj_Close'].plot(figsize=(16,8),title='Adjusted Closing Price')
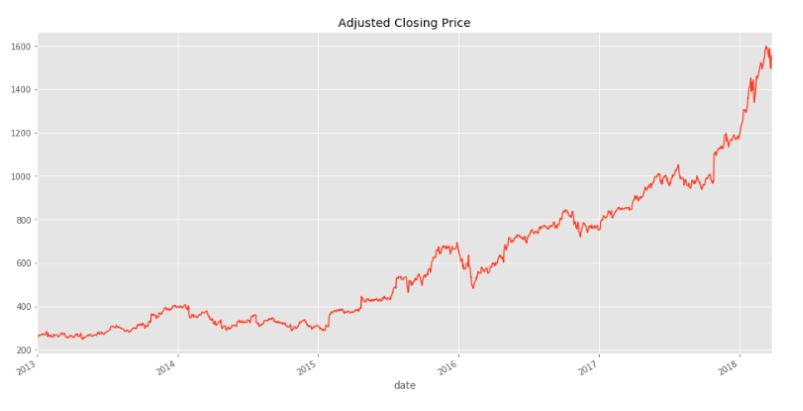
Интересно, что в течение периода 2013-2018 годов цена акций Amazon более или менее стабильно росла. Теперь мы будем использовать pandas для анализа и манипулирования этими данными, чтобы получить глубокие выводы.
pandas для анализа временных рядов
Поскольку pandas был разработан в контексте финансового моделирования, он содержит полный набор инструментов для работы с датами, временем и данными, индексированными по времени. Давайте рассмотрим основные структуры данных pandas для работы с данными временных рядов.
Манипулирование datetime
Основные инструменты Python для работы с датами и временем находятся во встроенном модуле datetime. В pandas один момент времени представлен как pandas.Timestamp, и мы можем использовать функцию datetime() для создания объектов datetime из строк в широком разнообразии форматов даты/времени. datetimes взаимозаменяемы с pandas.Timestamp.
from datetime import datetime
my_year = 2019
my_month = 4
my_day = 21
my_hour = 10
my_minute = 5
my_second = 30
Теперь мы можем создать объект datetime и свободно использовать его в pandas, учитывая вышеуказанные атрибуты.
test_date = datetime(my_year, my_month, my_day)
test_date


# datetime.datetime(2019, 4, 21, 0, 0)
Для целей анализа наших конкретных данных мы выбрали только день, месяц и год, но при необходимости мы могли бы включить и более подробную информацию, например, час, минуту и секунду.
test_date = datetime(my_year, my_month, my_day, my_hour, my_minute, my_second)
print('The day is : ', test_date.day)
print('The hour is : ', test_date.hour)
print('The month is : ', test_date.month)

# Output

The day is :  21
The hour is :  10
The month is :  4
Для нашего набора данных о ценах на акции тип столбца index - DatetimeIndex. Мы можем использовать pandas для получения минимальной и максимальной дат в данных.
print(data.index.max())
print(data.index.min())

# Output

2018-03-27 00:00:00
2013-01-02 00:00:00
Мы также можем рассчитать местоположение самой поздней даты и местоположение самого раннего индекса даты следующим образом:
# Earliest date index location
data.index.argmin()
#Output
1315
# Latest date location
data.index.argmax()
#Output
0
Временная передискретизация
Изучение данных о ценах на акции за каждый отдельный день не слишком полезно для финансовых учреждений, которые больше заинтересованы в выявлении рыночных тенденций. Чтобы упростить эту задачу, мы используем процесс, называемый временной выборкой, для объединения данных в определенный период времени, например, по месяцам или кварталам. Таким образом, учреждения могут видеть обзор цен на акции и принимать решения в соответствии с этими тенденциями.
В библиотеке pandas есть функция resample(), которая выполняет повторную выборку таких данных временного ряда. Метод resample в pandas аналогичен методу groupby, так как это, по сути, группировка по определенному временному интервалу. Функция resample() выглядит следующим образом:
data.resample(rule = 'A').mean()
Подведем итоги:
data.resample()используется для повторной выборки данных о запасах.- 'A' означает частоту в конце года и обозначает значения смещения, на которые мы хотим пересчитать данные.
mean()указывает, что нам нужна средняя цена акций за этот период.
Вывод выглядит следующим образом: средние данные по акциям отображаются на 31 декабря каждого года
Ниже приведен полный список значений смещения. Список также можно найти в документации pandas.

Псевдонимы смещения для передискретизации времени
Мы также можем использовать выборку времени для построения графиков для определенных столбцов.
data['Adj_Close'].resample('A').mean().plot(kind='bar',figsize = (10,4))
plt.title('Yearly Mean Adj Close Price for Amazon')
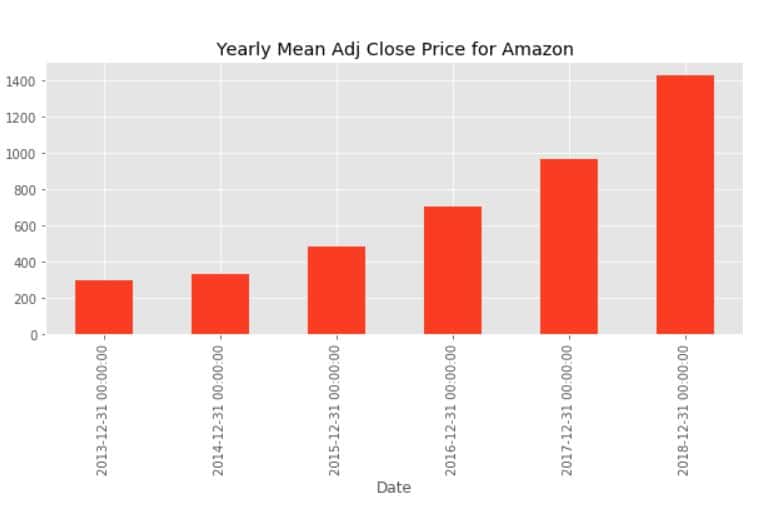
Приведенная выше гистограмма соответствует средней скорректированной цене закрытия Amazon на конец года для каждого года в нашем наборе данных.
Аналогично, ежемесячная максимальная цена открытия для каждого года приведена ниже.
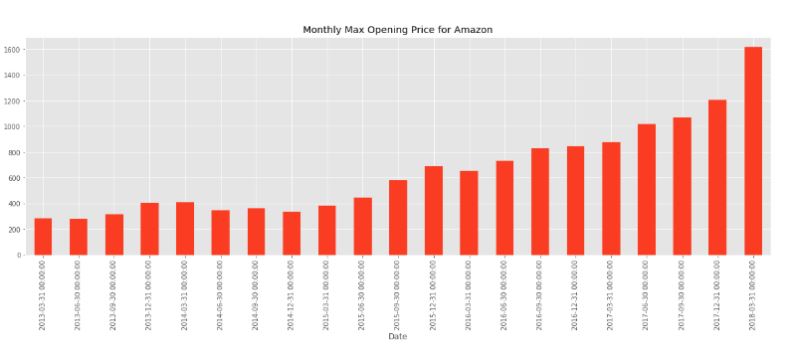
Месячная максимальная цена открытия на Amazon
Сдвиг во времени
Иногда нам может понадобиться сдвинуть или переместить данные вперед или назад во времени. Этот сдвиг выполняется по временному индексу на нужное количество приращений временной частоты.
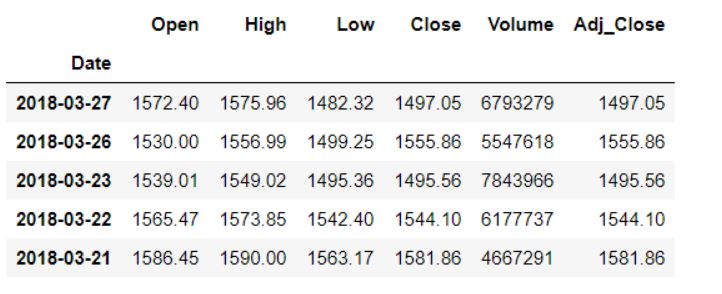
Вот исходный набор данных до каких-либо временных сдвигов.
Перемещение вперед
Чтобы сдвинуть наши данные вперед, мы передадим через функцию shift() желаемое количество периодов (или приращений), которое в данном случае должно быть положительным.
data.shift(1).head()
Здесь мы сдвинем наши данные вперед на один период или индекс, что означает, что все значения, которые ранее соответствовали строке N, теперь будут принадлежать строке N+1. Вот результат:
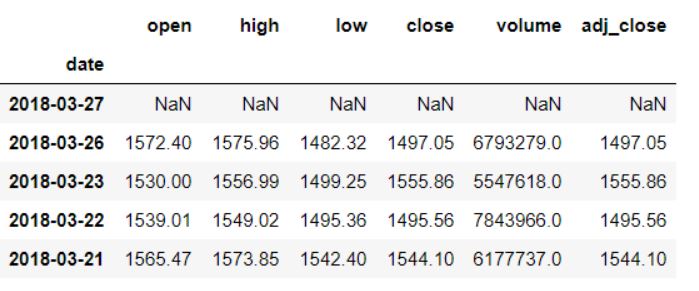
Сдвиг вперед на один индекс
Перемещение назад
Чтобы сдвинуть наши данные назад, количество периодов (или приращений) должно быть отрицательным.
data.shift(-1).head()
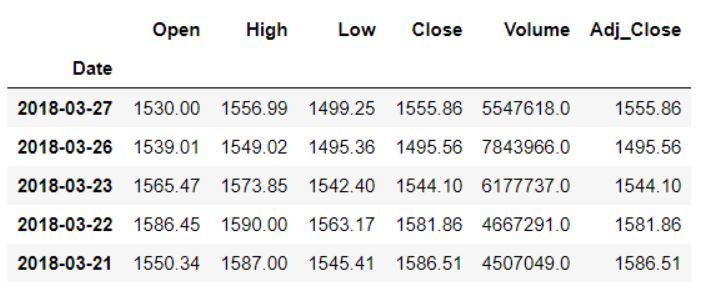
Сдвиг назад на один индекс
Начальная сумма, соответствующая 2018-03-27 сейчас составляет 1530, тогда как первоначально она составляла 1572.40.
Переключение на основе кода временной строки
Мы также можем использовать смещение из таблицы смещений для сдвига времени. Для этого мы воспользуемся функцией pandas shift(). Нам нужно передать только параметры periods и freq. Атрибут period задает количество шагов, на которое нужно сдвинуть, а параметры freq обозначают размер этих шагов.
Допустим, мы хотим сдвинуть данные на три месяца вперед:
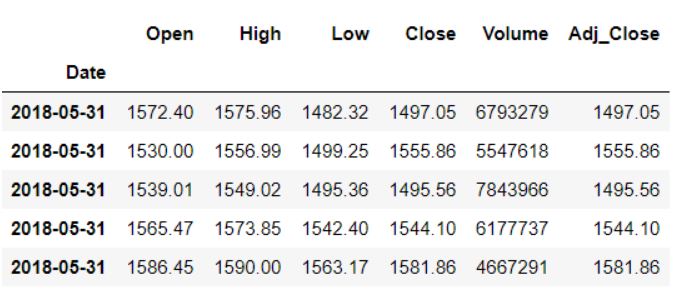
data.tshift(periods=3, freq = 'M').head()
В качестве выходного сигнала мы получим следующее:
Откатные окна
Данные временных рядов могут быть зашумлены из-за сильных колебаний на рынке. В результате становится трудно определить тенденцию или закономерность в данных. Вот визуализация скорректированной цены закрытия Amazon за несколько лет, где мы можем увидеть такой шум:
data['Adj_Close'].plot(figsize = (16,8))
Поскольку мы рассматриваем ежедневные данные, в них присутствует довольно много шума. Было бы неплохо, если бы мы могли усреднить его по неделям, и здесь на помощь приходит скользящее среднее. Скользящее среднее, или скользящее среднее, - это метод преобразования, который помогает усреднить шум в данных. Он работает путем простого разбиения и объединения данных в окна в соответствии с функцией, например mean(), median(), count() и т.д. Для этого примера мы будем использовать скользящее среднее значение за 7 дней.
data.rolling(7).mean().head(10)
Вот вывод:
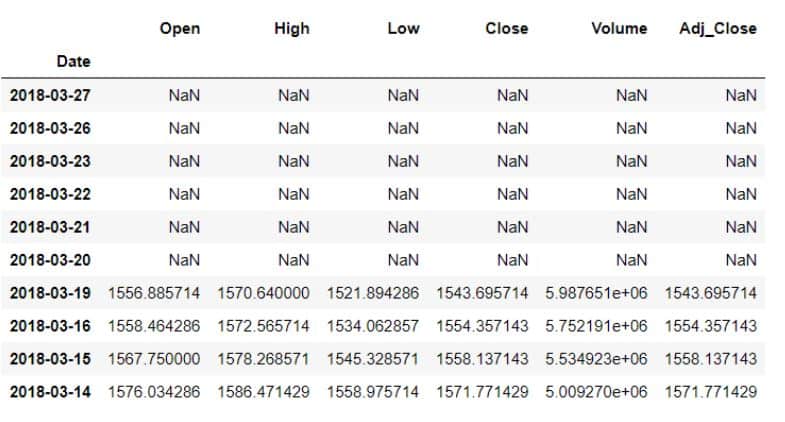
Первые шесть значений стали пустыми, так как при использовании окна в семь дней не было достаточно данных для их заполнения.
Итак, каковы основные преимущества расчета скользящего среднего или использования этого метода скользящего среднего? Наши данные становятся гораздо менее шумными и больше отражают тенденцию, чем сами данные. Давайте построим график. Сначала мы построим график исходных данных, а затем скользящих данных за 30 дней.
data['Open'].plot()
data.rolling(window=30).mean()['Open'].plot(figsize=(16, 6))
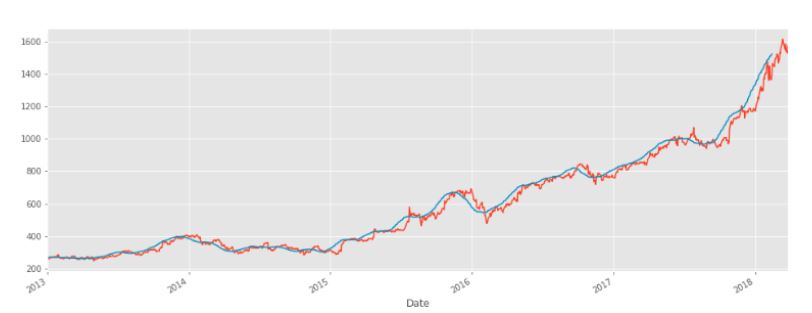
Оранжевая линия - это исходные данные об открытой цене. Синяя линия представляет 30-дневное скользящее окно и имеет меньше шума, чем оранжевая линия. Следует иметь в виду, что когда мы запустим этот код, первые 29 дней не будут иметь синей линии, потому что не было достаточно данных для расчета скользящего среднего значения.
Заключение
Библиотека pandas в Python - это мощная, всеобъемлющая библиотека с широким набором встроенных функций для анализа данных временных рядов. В этой статье мы рассмотрели, как pandas можно использовать для обработки и визуализации данных временных рядов.
Мы также выполняли такие задачи, как выборка времени, сдвиг времени и прокрутка с данными о запасах. Обычно это первые шаги в анализе любого временного ряда данных. В дальнейшем мы могли бы использовать эти данные для проведения базового финансового анализа, рассчитав ежедневное процентное изменение акций, чтобы получить представление о волатильности цен на акции. Другим способом использования этих данных может быть прогнозирование цен на акции Amazon на следующие несколько дней с помощью методов машинного обучения. Это было бы особенно полезно с точки зрения акционеров.
Вернуться на верх